Lincoln Nautilus: Noise, Vibration and Harshness / Noise, Vibration and Harshness (NVH). Diagnosis and Testing
Special Tool(s)

|
MASTERTECH MTS-4000 ANALYZER 257-00018 |

|
EngineEAR 107-R2100 Chassis Ears JSP97170 Squeak And Rattle Kit 164-R4900 |
|
Ultrasonic Leak Detector 134-R0135 |
Diagnostic Theory
The shortest route to an accurate diagnosis results from:
- System knowledge, including comparison with a known good system.
- System history, including repair history and usage patterns.
- Condition history, especially any relationship to repairs or sudden change.
- Knowledge of possible sources.
- Using a systematic diagnostic method that divides the system into related areas.
The diagnosis and correction of NVH symptoms requires:
- A road or system test to determine the exact nature of the symptom.
- An analysis of the possible causes.
- Testing to verify the cause.
- Repairing any symptoms found.
- A road test or system test to make sure the cause has been corrected or brought back to within acceptable range.
Diagnostic Procedure Overview
Qualifying the symptom by the particular sensation present can help narrow down the cause. Always use the "symptom" to "system" to "component" to "cause" diagnostic technique. This diagnostic method divides the problem into related areas to correct the customer concern.
- Verify the "symptom".
- Determine which "symptoms(s)" can cause the "symptom" using the diagnostic tools described in this section.
- After determining the possible "system(s)" , refer to the appropriate section in this manual to identify the worn or damaged "components".
- After identifying the 'components" , identify the "cause" of the failure.
Tools and Techniques
The diagnostic tools allow for a systematic collection of information that is necessary to accurately diagnose and repair NVH problems. Remember that the vibrating source component (originator) may only generate a small vibration. This small vibration can in turn cause a larger vibration/noise to emanate from another receiving component (reactor), due to contact with other components (transfer path). For the best results, carry out the test as follows:
- Test drive the vehicle with the vibration sensor inside the vehicle.
-
Place the sensor in the vehicle according to feel.
- If the condition is felt through the steering wheel, the source is most likely in the front of the vehicle.
- A vibration that is felt in the seat or floor only will most likely be found in the driveline, drive axle or rear wheels and tires.
-
Record the readings. Also note when the condition
begins, when it reaches maximum intensity and if it tends to diminish
above/below a certain speed.
- If a vibration symptom is vehicle speed related, the tire and wheel RPM /frequency and driveshaft frequency should be calculated.
- Frequencies with an amplitude reading of 0.06 Gs or less are barely perceptible NVH levels. No corrective action is necessary.
- Place the vibration sensor on or near the suspect area outside the vehicle.
- Continue the road test, driving the vehicle at the speed the symptom occurs, and take another reading.
-
Compare the readings.
- A match in frequency indicates the problem component or area.
The following diagnostic tools and techniques can be used separately or in conjunction with each other to aid in the diagnosis of NVH symptoms. They are listed in order of preference for ease in their use for locating these symptoms.
Noise, Vibration and Harshness (NVH) Analyzer (Vetronix)
The MTS 4000 and the MTS 4100 NVH analyzers are tools to aid in the identification and isolation of a noise, vibration or harshness symptom in a vehicle. They measure noise and vibration data and compare it with data obtained from the vehicle's PCM as well as vehicle variants that were entered by the user such as pulley size, axle ratio and tire size in order to provide possible sources. The MTS 4000 and the MTS 4100 have the following characteristics:
- Interface with the vehicle's computer system
- Support and store vibration data input from 1 or 2 accelerometers
- Support and store noise data input from 2 microphones
- Provide a photo-tachometer for operation of the driveshaft balancing function
- Provide a strobe output capable of driving a standard timing light
- Contain a real-time clock circuit that provides time and date information which is used for tagging test data
- Have the capability to print to an external printer and interface with a personal computer
- Can be powered from a variety of power sources: cigarette lighter, AC power or the internal battery pack
The MTS 4000 and the MTS 4100 NVH analyzers have 4 main operating modes. The first is for vibration diagnosis. This mode measures data from 1 or 2 accelerometers simultaneously while obtaining data from the vehicle. Then it carries out a frequency analysis on the accelerometer information and compares the vibration frequencies with the frequencies associated with various rotating components within the vehicle. The data can be presented in 4 different display modes: principle component, bar chart, frequency spectrum or waterfall. All display mode formats contain the same common elements, such as amplitude.
The second is for noise diagnosis. This mode measures noise from 1 or 2 microphones simultaneously. All noise measurements are in decibels (dB). All frequency bands used for noise measurements are the same as for the vibration measurements, up to 1,000 Hertz (Hz).
The third is the strobe. A strobe or standard timing light can be connected to an analyzer, to provide a means for measuring rotation speed. The strobe function is used for isolating the source of a vibration.
Electronic Vibration Analyzer (EVA)
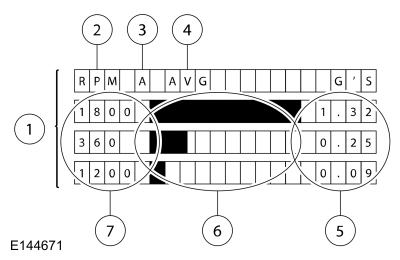
The Electronic Vibration Analyzer (EVA) is a hand-held electronic scan tool which will assist in locating the source of unacceptable vibrations. The vibration sensor can be remotely mounted anywhere in the vehicle for testing purposes. The unit displays the 3 most common vibration frequencies and their corresponding amplitudes simultaneously. A bar graph provides a visual reference of the relative signal strength (amplitude) of each vibration being displayed and its relative G-force. The keypad is arranged to make the Electronic Vibration Analyzer (EVA) simple to program and use. Some of the functions include the ability to average readings as well as record, play back and freeze readings. The Electronic Vibration Analyzer (EVA) has a strobe balancing function that can be used to detect imbalance on rotating components such as a driveshaft or engine accessories.
| Item | Description |
|---|---|
| 1 | Electronic Vibration Analyzer (EVA) screen |
| 2 | Frequency mode displayed in RPM or Hertz (Hz) |
| 3 | Active sensor input (A or B) |
| 4 | Current active mode |
| 5 | G-force indicators or the strongest frequencies in descending strength of each vibration |
| 6 | Strength of each vibration |
| 7 | Frequency in RPM / Hertz (Hz) of each vibration |
Record the readings taken with the diagnostic tool.
- Frequencies should be read in the "average" mode.
- Frequencies have a range of plus or minus 2 Hertz (Hz). A reading of 10 Hertz (Hz) can be displayed as an 8 Hertz (Hz) through 12 Hertz (Hz).
Vibrate Software
Vibrate Software is a diagnostic aid which will assist in pinpointing the source of unacceptable vibrations. The engine's crankshaft is the point of reference for vibration diagnosis. Every rotating component will have an angular velocity that is faster, slower or the same as the engine's crankshaft. Vibrate Software® calculates the angular velocity of each component and graphically represents these velocities on a computer screen and on a printed vibration worksheet. The following steps outline how Vibrate Software® helps diagnose a vibration symptom:
- Enter the vehicle information. Vibrate will do all the calculations and display a graph showing tire and driveline vibrations.
- Print a Vibration Worksheet graph. The printed graph is to be used during the road test.
-
Road test the vehicle at the speed where the vibration is most
noticeable. Record the vibration frequency RPM and the engine RPM on the
worksheet graph. The point on the graph where the vibration frequency
RPM reading and the engine RPM reading intersect indicates the specific
component group causing the symptom.
- A frequency measurement tool capable of measuring vibration frequency and RPM will be needed.
- Provides graphics of diagnostic procedures to aid in testing components.
Reed Tachometer
The Reed tachometer is a hand-held vibration sensor which will assist in locating the source of unacceptable vibrations. The vibration sensor can be placed anywhere in the vehicle for testing purposes. The Reed tachometer contains several reeds that are tuned to vibrate or resonate at different frequencies ranging from 10 to 80 Hertz (Hz) or 600 to 4,800 RPM . Though the Reed tachometer is able to measure multiple frequencies, it does not measure amplitude.
Sirometer
The Sirometer measures frequency in Hertz (Hz) and RPM . To use the Sirometer, place it on any vibrating component and slowly scroll the wire out by turning the knob. As the length of wire changes, so does its natural frequency. Find the length of wire that vibrates with the highest amplitude. This frequency will match that of the vibrating component. Read the frequency for that length of wire.
Combination EngineEAR/ChassisEAR
An electronic listening device used to quickly identify noise and the location under the chassis while the vehicle is being road tested. The ChassisEARs can identify the noise and location of damaged/worn wheel bearings, constant velocity joints, brakes, springs or axle bearings.
EngineEAR Basic Unit
An electronic listening device used to detect even the faintest noises. The EngineEARs can detect the noise of damaged/worn bearings in generators, coolant pumps, A/C compressors and power steering pumps. They are also used to identify noisy lifters, exhaust manifold leaks, chipped gear teeth and for detecting wind noise. The EngineEAR has a sensing tip, amplifier and headphones. The directional sensing tip is used to listen to the various components. Point the sensing tip at the suspect component and adjust the volume with the amplifier. Placing the tip in direct contact with a component will reveal structure-borne noise and vibrations, generated by or passing through, the component. Various volume levels can reveal different sounds.
Mechanic's Stethoscope
A mechanics stethoscope is an inexpensive tool for locating noises in motors and other moving parts. It can be used to help diagnose worn gears, faulty valves, coolant pump failure, damaged gaskets, defective bearings and body squeaks.
Squeak and Rattle Repair Kit
The Squeak and Rattle Repair Kit contains lubricants and self-adhesive materials that can be used to eliminate interior and exterior squeaks and rattles. The kit consists of the following materials:
- PVC (soft foam) tape
- Urethane (hard foam) tape
- Flocked (black fuzzy) tape
- Ultra High Molecular Weight (UHMW) (frosted) tape
- Squeak and rattle oil tube
- Squeak and rattle grease tube
Leak Detector
The Leak Detector is used to detect wind noises caused by leaks and gaps in areas where there is weatherstripping or other sealing material. It is also used to identify A/C leaks, vacuum leaks and evaporative emission noises. The Leak Detector includes a multi-directional transmitter (operating in the ultrasonic range) and a hand-held detector. The transmitter is placed inside the vehicle. On the outside of the vehicle, the hand-held detector is used to sweep the area of the suspected leak. As the source of the leak is approached, a beeping sound is produced which increases in both speed and frequency.
Diagnostic Guide
To begin a successful diagnosis, record the reported findings, then proceed to each of the numbered process steps to complete the diagnosis.
1: Customer Interview
The diagnostic process starts with the customer interview. The service advisor must obtain as much information as possible about the problem and take a test drive with the customer. There are many ways a customer will describe NVH concerns and this will help minimize confusion arising from descriptive language differences. It is important that the concern is correctly interpreted and the customer descriptions are recorded. During the interview, ask the following questions:
- When was it first noticed?
- Did it appear suddenly or gradually?
- Did any abnormal occurrence coincide with or proceed its appearance?
Use the information gained from the customer to accurately begin the diagnostic process.
2: Pre-Drive Check
It is important to do a pre-drive check before road testing the vehicle. A pre-drive check verifies that the vehicle is safe to drive and eliminates any obvious faults on the vehicle.
The pre-drive check consists of a brief visual inspection. During this brief inspection, take note of anything that will compromise safety during the road test and make those repairs/adjustments before taking the vehicle on the road.
3: Preparing for the Road Test
Observe the following when preparing for the road test:
- Review the information provided by the customer. It is important to know the specific concern the customer has with the vehicle.
- Do not be misled by the reported location of the noise/vibration. The cause can actually be some distance away.
- Remember that the vibrating source component (originator) may only generate a small vibration. This small vibration can in turn cause a larger vibration/noise to emanate from another receiving component (reactor) due to contact with other components (transfer path).
- Conduct the road test on a quiet street where it is safe to duplicate the vibration/noise. The ideal testing route is an open, low-traffic area where it is possible to operate the vehicle at the speed at which the condition occurs.
- If possible, lower the radio antenna in order to minimize turbulence. Identify anything that could potentially make noise or be a source of wind noise. Inspect the vehicle for add-on items that create vibration/noise. Turn off the radio and the heating and cooling system blower.
4: Verify the Customer Concern
Verify the customer concern by carrying out a road test.
A road test may be necessary if the symptom relates to the suspension system or is sensitive to torque.Remember, a condition will not always be identifiable by carrying out these tests; however, they will eliminate many possibilities if carried out correctly.
5: Road Test
NOTE: It may be necessary to have the customer ride along or drive the vehicle to point out the concern. During the road test, take into consideration the customer's driving habits and the driving conditions. The customer's concern just may be an acceptable operating condition for that vehicle.
The following is a brief overview of each test. A review of this information helps to quickly identify the most appropriate process necessary to make a successful diagnosis. After reviewing this information, select and carry out the appropriate test(s), proceeding to the next step of this process.
- The Slow Acceleration Test is normally the first test to carry out when identifying an NVH concern, especially when a road test with the customer is not possible.
- The Heavy Acceleration Test helps to determine if the concern is torque-related.
- The Neutral Coast Down Speed Test helps to determine if the concern is vehicle speed-related.
- The Steering Input Test helps to determine how the wheel bearings and other suspension components contribute to a vehicle speed-related concern.
- The Brake Test helps to identify vibrations or noise that are brake related.
- The Road Test Over Bumps helps isolate a noise that occurs when driving over a rough or bumpy surface.
- To identify if the noise is coming from the electric motor and /or gearbox (such as for a whine issue), it can be helpful sometimes to shift into neutral while driving while the condition is present.
- The Vehicle Cold Soak Procedure helps to identify concerns occurring during initial start-up and when an extended time lapse occurs between vehicle usage.
Slow Acceleration Test
To carry out this test, proceed as follows:
- Slowly accelerate to the speed where the reported concern occurs. Note the vehicle speed, and if possible, determine the vibration frequency.
- Attempt to identify what part of the vehicle the concern is coming from.
- Attempt to identify the source of the concern.
- Proceed as necessary.
Heavy Acceleration Test
To carry out this test, proceed as follows:
- Accelerate hard from 0-64 km/h (0-40 mph).
- Decelerate in a lower gear.
- The concern is torque related if duplicated while carrying out this test.
- Proceed as necessary.
Neutral Coast Down Speed Test
To carry out this test, proceed as follows:
- Drive at a higher rate of speed than where the concern occurred when carrying out the Slow Acceleration Test.
- Place the transmission in NEUTRAL and coast down past the speed where the concern occurs.
- The concern is vehicle speed-related if duplicated while carrying out this test. This eliminates the electric motor as a source.
- Proceed as necessary.
Steering Input Test
To carry out this test, proceed as follows:
- Drive at the speed where the concern occurs, while making sweeping turns in both directions.
- If the concern goes away or gets worse, the wheel bearings, hubs and tire tread wear are all possible sources.
- Proceed as necessary.
Brake Test
To carry out this test, proceed as follows:
- Warm the brakes by slowing the vehicle a few times from 80-32 km/h (50-20 mph) using light braking applications. At highway speeds of 89-97 km/h (50-60 mph), apply the brake using a light pedal force.
- Accelerate to 89-97 km/h (55-60 mph).
- Lightly apply the brakes and slow the vehicle to 30 km/h (20 mph).
- A brake vibration noise can be felt in the steering wheel, seat or brake pedal. A brake noise can be heard upon brake application and diminish when the brake is released.
- If the source of the symptom has been identified as a result of this test, proceed to the appropriate brake section(s) for further diagnosis and repair. If the source has not been identified, continue with the road test.
Road Test Over Bumps
To carry out this test, proceed as follows:
- Drive the vehicle over a bumpy or rough surface one wheel at a time to determine if the noise is coming from the front or the back and the left or the right side of the vehicle.
- Proceed as necessary.
Vehicle Cold Soak Procedure
To carry out this procedure, proceed as follows:
- Test preparations include matching the customer conditions (if known). If not known, document the conditions. Monitor the vibration/noise duration with a watch for up to 3 minutes.
- Park the vehicle where testing will occur. The vehicle must remain at or below the concern temperature (if known) for 6-8 hours.
- Before starting the vehicle, conduct a visual inspection under the hood.
- Listen for pumps that circulate coolant for motor, electronics, heater and battery.
-
NOTICE: Never probe moving parts.
Isolate the vibration/noise by carefully listening. Move around the vehicle while listening to find the general location of the vibration/noise. Then, search for a more precise location by using a stethoscope or EngineEAR. - If the source of the symptom has been identified as a result of this test, proceed to the appropriate section for further diagnosis and repair. If the source has not been identified, continue with the road test.
Symptom Charts
Noise, Vibration and Harshness (NVH) Symptoms
Classify Noise, Vibration and Harshness (NVH) Symptoms
For NVH concerns, it is necessary to classify the customer's concern into one of the 3 categories: noise, vibration or harshness. The reason for this is that a customer concern may consist of a combination of symptoms involving noise and vibration, or vibration and harshness. In cases where there are combination symptoms, determine which diagnostic path to follow: noise, vibration or harshness. For example, if a customer has a concern involving a noise and a vibration, and it is determined that it is vehicle speed-related, follow the vibration diagnostic path.
Noise Symptoms
Once a symptom is classified as a noise, the particular conditions under which the noise occurs need to be identified. These conditions are identified and verified during the road test. For example, a noise may only occur while turning. The next step is to determine which systems on the vehicle are related to that condition. In this case, the steering system and wheel/tire system may be suspect. After identifying possible systems, a preliminary inspection of these systems should be done. If the source of noise is still unidentified, use a listening device (such as the ChassisEAR) to pinpoint the source. Once the source has been identified, determine if this source is related to the suspected system previously identified. If it is related, then complete the repair to resolve the customer concern. If it is unrelated, then it is possible that the source of the noise is a reactor to a noise being transmitted through a transfer path. If this is the case, repairing the reactor will not resolve the customer concern. The transfer path must be identified and a determination made if the noise is normal, but accentuated by the transfer path (conductor), or if the originator is the fault causing excessive noise to transfer to another component through a conductor. There is a relationship between systems identified as related to conditions and the noise transfer path. In some cases, the condition under which the noise occurs has nothing to do with the identified source. This relationship is important in the diagnosis of noise concerns. It is the first clue that the identified source of noise might be a reactor and that further investigation is needed to diagnose a possible noise transfer path concern. Based on the results from the road test, make a determination of which action in the symptom chart to take first.
Vibration Symptoms
Most vibrations consist of movements back and forth or up and down that repeat. Every time the vibrating component goes through its complete range of motion and returns to the starting point is called a cycle. The rate at which these cycles occur within a given time is called the frequency. Frequency is measured in cycles per second or Hertz (Hz). One cycle per second equals one Hertz (Hz). Once the frequency of a vibration is known, calculations can be done to determine the system that is the source of the concern.
Order of Vibration
The order of a vibration refers to how often the vibration is present in one revolution of the component. For example, a vibration that is present once each revolution of a component would be a first order vibration. A vibration present twice each revolution of the component would be a second order vibration. Vibration orders do not have to be whole numbers, they can have decimal values such as 1.5 order vibration or 3.08 order vibration.
The concept of order of vibration is important to remember when the measured frequency of a vibration does not seem to match the frequency calculations of any of the likely systems or components. As the order increases, the frequency of the vibration will also increase by a multiple of that number.
For example, vibration may be present where the frequency is measured at 14 Hertz (Hz). After doing the necessary calculations it is determined the first order tire and wheel frequency is 7 Hertz (Hz) and the first order driveshaft frequency is 22 Hertz (Hz). Based on this information it can be determined the vibration is most likely a second order tire and wheel vibration: 7 Hertz (Hz) (first order tire and wheel frequency) multiplied by 2 (second order) equals 14 Hertz (Hz) (second order tire and wheel frequency).
Relationship of Vibration Frequency to Order of Vibration
After carrying out the road test as described in this section, the vibration was determined to be either vehicle-speed related or electric motor-speed related. That determination will identify the vibration frequency calculations that should be done.
| Vibration Type | Calculate |
|---|---|
| Vehicle-speed related | Tire-speed vibration frequency, Driveshaft-speed vibration frequency |
In calculating and using frequency readings it is important to remember the direct relationship between Hertz (Hz) andRPM . One Hertz (Hz) is equal to 60 RPM . This is easy to remember. Think of Hertz (Hz) as cycles per second. There are 60 seconds in a minute, therefore multiply the Hertz (Hz) reading by 60 to get RPM . Conversely, divide RPM by 60 to get Hertz (Hz).
Use the Frequency and RPM Calculations Worksheet to calculate system/component frequencies. The worksheet provides the necessary steps to determine each system/component group frequency.
Frequency Calculations
Calculating Tire and Wheel Frequency
For a vibration concern, use the vehicle speed to determine tire/wheel frequency and RPM . Calculate the tire and wheel RPM and frequency by carrying out and following:
- Measure the diameter of the tire.
- Record the speed at which the vibration occurs.
-
Obtain the corresponding tire and wheel RPM and frequency from the Tire Speed and Frequency Chart.
- If the vehicle speed is not listed, divide the vehicle speed at which the vibration occurs by 16 km/h (10 mph). Multiply that number by the 16 km/h (10 mph) tire RPM listed for that tire diameter in the chart. Then divide that number by 60. For example: a 40 MPH (Miles Per Hour) vibration with 835 mm (33 in) tires. 40 divided by 10 = 4. Multiply 4 by 105 = 420 RPM . Divide 420 RPM by 60 seconds = 7 Hertz (Hz) at 40 MPH (Miles Per Hour).
Tire Speed and Frequency Chart
| Tire Diameter | Tire Revolutions Per Minute (RPM)/Hertz (Hz) at value listed below | Tire Revolutions Per Minute (Revolutions Per Minute (RPM)/Hertz (Hz) at value listed below | Tire Revolutions Per Minute (RPM)/Hertz (Hz) at value listed below | Tire Revolutions Per Minute (RPM)/Hertz (Hz) at value listed below |
|---|---|---|---|---|
| in ( mm) | 9.9 mph ( 16 km/h) | 49.7 mph ( 80 km/h) | 60.3 mph ( 97 km/h) | 70.2 mph ( 113 km/h) |
| 19.02 in ( 483 mm) | 182 | 910/15 | 1092/18 | 1274/21 |
| 20.00 in ( 508 mm) | 173 | 865/14 | 1038/17 | 1211/20 |
| 20.98 in ( 533 mm) | 165 | 825/14 | 990/16 | 1155/19 |
| 22.05 in ( 560 mm) | 158 | 790/13 | 948/16 | 1106/18 |
| 23.03 in ( 585 mm) | 151 | 755/13 | 906/15 | 1057/18 |
| 24.02 in ( 610 mm) | 145 | 725/12 | 870/14 | 1015/17 |
| 25.00 in ( 635 mm) | 139 | 695/12 | 834/14 | 973/16 |
| 25.98 in ( 660 mm) | 134 | 670/11 | 804/13 | 938/16 |
| 26.97 in ( 685 mm) | 129 | 645/11 | 774/13 | 903/15 |
| 27.95 in ( 710 mm) | 124 | 620/10 | 744/12 | 868/14 |
| 28.94 in ( 735 mm) | 119 | 595/10 | 714/12 | 833/14 |
| 29.92 in ( 760 mm) | 115 | 575/10 | 690/11 | 805/13 |
| 30.91 in ( 785 mm) | 111 | 555/9 | 666/11 | 777/13 |
| 31.89 in ( 810 mm) | 108 | 540/9 | 648/11 | 756/13 |
| 32.87 in ( 835 mm) | 105 | 525/9 | 630/10 | 735/12 |
| 34.02 in ( 864 mm) | 102 | 510/8 | 612/10 | 714/12 |
Harshness Symptoms
Harshness is customer perception which gives the impression of no isolation from the tire/wheel and suspension system. Harshness may be caused by road conditions, temperature changes, component damage and/or incorrect customer modifications on original components/specifications. Customers usually experience harshness when the vehicle is driving over bumps or potholes and in cold weather conditions. Harshness can also be experienced with excessive tire pressure, sporty tires, heavy-duty springs and shocks, or other vehicle modifications. Some aftermarket tires, even with the correct size, may change vehicle behavior and produce customer concerns. The first step in diagnosing a harshness concern is to determine if the concern was experienced only in certain specific operating conditions, such as large potholes or extremely cold weather. In these cases, harshness should be considered normal. A known good vehicle can be driven under the same conditions and the rides can be compared to determine whether the concern is normal or vehicle specific. The second step is to check tire pressure and make sure it was set within vehicle specifications. The third step is to inspect for aftermarket or modified components and determine if they are the cause of the harshness complaint. If the harshness concern persists after the above steps, it is possible that some components are damaged. Based on the results from the road test, make a determination of which action in the symptom chart to take first.
Noise, Vibration and Harshness (NVH) Symptom Chart Categories
A good diagnostic process is a logical sequence of steps that lead to the identification of a causal system. Use the symptom and possible system categories as follows:
- Identify the operating condition that the vehicle is exhibiting.
- Match the operating condition to the symptom.
- Verify the symptom.
- Calculate the frequency and order of the symptom.
- Identify which category or system(s) could cause the symptom.
- The section indicated to identify and diagnose the symptom or confirm that the system is not the source of the condition.
Use the diagnostic instructions in this section along with the necessary listed tools to identify the vibration order and to isolate the symptom and the possible systems associated with that symptom. Then based on the results from the road test, make a determination of which action in the symptom chart to take first. Since it is possible any one of multiple systems may be the cause of the symptom, it may be necessary to use a process of elimination type diagnostic approach to pinpoint the concern.
Symptom Chart: Vehicle-Speed Related Vibrations
NOTE: Any assembly that is out of balance will only cause a first order vibration, it will not cause a higher order vibration.
When a vehicle-speed related vibration is present, both tire-speed related vibration and axle shaft-speed related vibration calculations should be carried out.
Symptom Chart-Tire-Speed Related Vibrations
Symptom Chart
| Condition | Possible Sources | Actions |
|---|---|---|
| First order tire vibration | Tire or wheel |
Symptom Chart: NVH
REFER to: Wheels and Tires (204-04A Wheels and Tires, Diagnosis and Testing). |
| Wheel bearings |
Symptom Chart: NVH
REFER to: Front Suspension (204-01 Front Suspension, Diagnosis and Testing). or REFER to: Rear Suspension (204-02 Rear Suspension, Diagnosis and Testing). |
|
|
Symptom Chart: NVH
REFER to: Front Drive Halfshafts (205-04 Front Drive Halfshafts, Diagnosis and Testing). or REFER to: Rear Drive Halfshafts (205-05 Rear Drive Halfshafts, Diagnosis and Testing). |
|
| Brake rotor or drum |
Symptom Chart: NVH
REFER to: Brake System (206-00 Brake System - General Information, Diagnosis and Testing). |
|
| Second order tire vibration | Tire or wheel |
Symptom Chart: NVH
REFER to: Wheels and Tires (204-04A Wheels and Tires, Diagnosis and Testing). |
| Third order tire vibration | Tire or wheel |
Symptom Chart:NVH
REFER to: Wheels and Tires (204-04A Wheels and Tires, Diagnosis and Testing). |
|
Symptom Chart: NVH
REFER to: Front Drive Halfshafts (205-04 Front Drive Halfshafts, Diagnosis and Testing). or REFER to: Rear Drive Halfshafts (205-05 Rear Drive Halfshafts, Diagnosis and Testing). |
Symptom Chart-Driveshaft-Speed Related Vibrations
Symptom Chart
| Condition | Possible Sources | Actions |
|---|---|---|
| First order driveshaft vibration |
|
Symptom Chart: NVH
REFER to: Front Drive Halfshafts (205-04 Front Drive Halfshafts, Diagnosis and Testing). or REFER to: Rear Drive Halfshafts (205-05 Rear Drive Halfshafts, Diagnosis and Testing). |
| Second order driveshaft vibration | CV -joint |
Symptom Chart: NVH
REFER to: Front Drive Halfshafts (205-04 Front Drive Halfshafts, Diagnosis and Testing). or REFER to: Rear Drive Halfshafts (205-05 Rear Drive Halfshafts, Diagnosis and Testing). |
| Third order driveshaft vibration | Drive axle |
Symptom Chart: NVH
REFER to: Front Drive Halfshafts (205-04 Front Drive Halfshafts, Diagnosis and Testing). or REFER to: Rear Drive Halfshafts (205-05 Rear Drive Halfshafts, Diagnosis and Testing). |
Symptom Chart: Powertrain-Speed Related Vibrations
NOTE: Any assembly that is out of balance will only cause a first order vibration, it will not cause a higher order vibration.
NOTE: Some powertrain-speed related vibrations are normal though they should not be felt in the passenger compartment.
Symptom Chart
| Condition | Possible Sources | Actions |
|---|---|---|
| First through sixth order powertrain vibration | Transmission/transaxle | Symptom Chart: NVH or |
| Transmission/transaxle mounts | Symptom Chart: NVH or | |
| Accessory speed related vibration | Coolant pump(s) |
Symptom Chart: NVH
REFER to: Engine (303-00) . |
| A/C compressor motor |
Symptom Chart: NVH
REFER to: Climate Control System (412-00 Climate Control System - General Information, Diagnosis and Testing). |
Symptom Chart: Engine-Speed Related Vibrations
NOTE: When an engine-speed related vibration is present, engine, engine accessory and engine firing calculations should be carried out.
NOTE: Any assembly that is out of balance will only cause a first order vibration, it will not cause a higher order vibration.
NOTE: Some powertrain-speed related vibrations are normal though they should not be felt in the passenger compartment.
Symptom Chart
| Condition | Possible Sources | Actions |
|---|---|---|
| 0.5 order engine vibration | Engine |
Symptom Chart: NVH
REFER to: Engine (303-00) . |
| Engine |
Symptom Chart: NVH
REFER to: Engine (303-00) . |
|
| First through sixth order engine vibration | Engine |
Symptom Chart: NVH
REFER to: Engine (303-00) . |
| Engine mounts |
Symptom Chart: NVH
REFER to: Engine (303-00) . |
|
| Transmission/transaxle | Symptom Chart: NVH or | |
| Exhaust system |
Symptom Chart: NVH
REFER to: Exhaust System (309-00B Exhaust System - 2.7L EcoBoost (238kW/324PS), Diagnosis and Testing). or REFER to: Exhaust System (309-00B Exhaust System - 2.7L EcoBoost (238kW/324PS), Diagnosis and Testing). |
|
| Belt driven accessory drive vibration | Engine pulley |
Symptom Chart: NVH
REFER to: Engine (303-00) . |
| Accessory drive belt |
Symptom Chart: NVH
REFER to: Accessory Drive (303-05B Accessory Drive - 2.7L EcoBoost (238kW/324PS), Diagnosis and Testing). or REFER to: Accessory Drive (303-05A Accessory Drive - 2.0L EcoBoost (184kW/250PS) – MI4, Diagnosis and Testing). |
|
| Coolant pump |
Symptom Chart: NVH
REFER to: Engine (303-00) . |
|
| Generator |
Symptom Chart: NVH
REFER to: Charging System - 2.7L EcoBoost (238kW/324PS) (414-00 Charging System - General Information, Diagnosis and Testing). or |
|
| A/C compressor |
Symptom Chart: NVH
REFER to: Climate Control System (412-00 Climate Control System - General Information, Diagnosis and Testing). |
Symptom Chart: Noise, Air Leaks or Water Leaks
Symptom Chart
| Condition | Possible Sources | Actions |
|---|---|---|
| Wind noise, air or water leaks |
|
Symptom Chart: Body System - General Information REFER to: Body System (501-00 Body System - General Information, Diagnosis and Testing). REFER to: Roof Opening Panel (501-17 Roof Opening Panel, Diagnosis and Testing). |
| Front end noise while driving vehicle | Front suspension |
Symptom Chart: NVH
REFER to: Front Suspension (204-01 Front Suspension, Diagnosis and Testing). |
| Drive axle |
Symptom Chart: NVH
REFER to: Front Drive Halfshafts (205-04 Front Drive Halfshafts, Diagnosis and Testing). or REFER to: Rear Drive Halfshafts (205-05 Rear Drive Halfshafts, Diagnosis and Testing). |
|
| Brake system |
Symptom Chart: NVH
REFER to: Brake System (206-00 Brake System - General Information, Diagnosis and Testing). |
|
| Steering components |
Symptom Chart: NVH
REFER to: Steering Column (211-04 Steering Column, Diagnosis and Testing). |
|
| Transmission/transaxle |
Symptom Chart: NVH
REFER to: External Controls (307-05A Automatic Transmission External Controls - 8-Speed Automatic Transmission – 8F57, Diagnosis and Testing). |
|
| Body |
Symptom Chart: Body System - General Information REFER to: Body System (501-00 Body System - General Information, Diagnosis and Testing). |
|
| Rear end noise while driving vehicle | Rear suspension |
Symptom Chart: NVH
REFER to: Rear Suspension (204-02 Rear Suspension, Diagnosis and Testing). |
| Drive axle |
Symptom Chart: NVH
REFER to: Front Drive Halfshafts (205-04 Front Drive Halfshafts, Diagnosis and Testing). or REFER to: Rear Drive Halfshafts (205-05 Rear Drive Halfshafts, Diagnosis and Testing). |
|
| Brake system |
Symptom Chart: NVH
REFER to: Brake System (206-00 Brake System - General Information, Diagnosis and Testing). |
|
| Transmission/transaxle | Symptom Chart: NVH or | |
| Body |
Symptom Chart: Body System - General Information REFER to: Body System (501-00 Body System - General Information, Diagnosis and Testing). |
|
| Noise with vehicle stopped | Transmission/transaxle | Symptom Chart: NVH or |
| A/C compressor motor |
Symptom Chart: NVH
REFER to: Climate Control System (412-00 Climate Control System - General Information, Diagnosis and Testing). |
|
| Body |
Symptom Chart: Body System - General Information REFER to: Body System (501-00 Body System - General Information, Diagnosis and Testing). |
Symptom Chart: Harshness
Symptom Chart
| Condition | Possible Sources | Actions |
|---|---|---|
| Harsh vehicle ride | Front suspension |
Symptom Chart: NVH
REFER to: Front Suspension (204-01 Front Suspension, Diagnosis and Testing). |
| Rear suspension |
Symptom Chart: NVH
REFER to: Rear Suspension (204-02 Rear Suspension, Diagnosis and Testing). |
 Noise, Vibration and Harshness (NVH). Description and Operation
Acceptable Noise, Vibration and Harshness (NVH)
Noise is any undesirable sound, usually unpleasant in nature. Vibration
is any motion, shaking or trembling, that can be felt or seen when an
object moves back and forth or up and down...
 Chassis
..
Other information:
Lincoln Nautilus 2018-2026 Service Manual: Front Door Alignment. General Procedures
Inspection NOTE: Removal steps in this procedure may contain installation details. NOTE: LH side shown, RH side similar. Inspect the front door-to-body dimensions. Refer to: Body and Frame (501-26 Body Repairs - Vehicle Specific Information and Tolerance Checks, Description and Operation). Adjustment All alignments Open the door. ..
Lincoln Nautilus 2018-2026 Service Manual: Roof Opening Panel Motor. Removal and Installation
Removal NOTE: Removal steps in this procedure may contain installation details. Place the roof opening panel glass in the fully CLOSE position. Place the roof opening panel shield to the fully OPEN position. Lower the headliner. Refer to: Headliner - Lowering (501-05) . Roof Opening Panel Motor - Glass ..
Categories
- Manuals Home
- 1st Generation Nautilus Owners Manual
- 1st Generation Nautilus Service Manual
- Engine Oil Capacity and Specification - 2.0L
- Fuel Quality
- USB Ports
- New on site
- Most important about car
Locating the Pre-Collision Assist Sensors
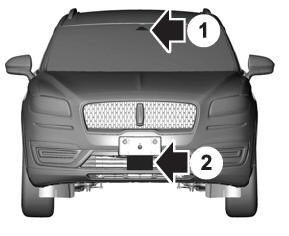
If a message regarding a blocked sensor or camera appears in the information display, something is obstructing the radar signals or camera images. The radar sensor is behind the fascia cover in the center of the lower grille. With a blocked sensor or camera, the system may not function, or performance may reduce. See Pre-Collision Assist – Information Messages.